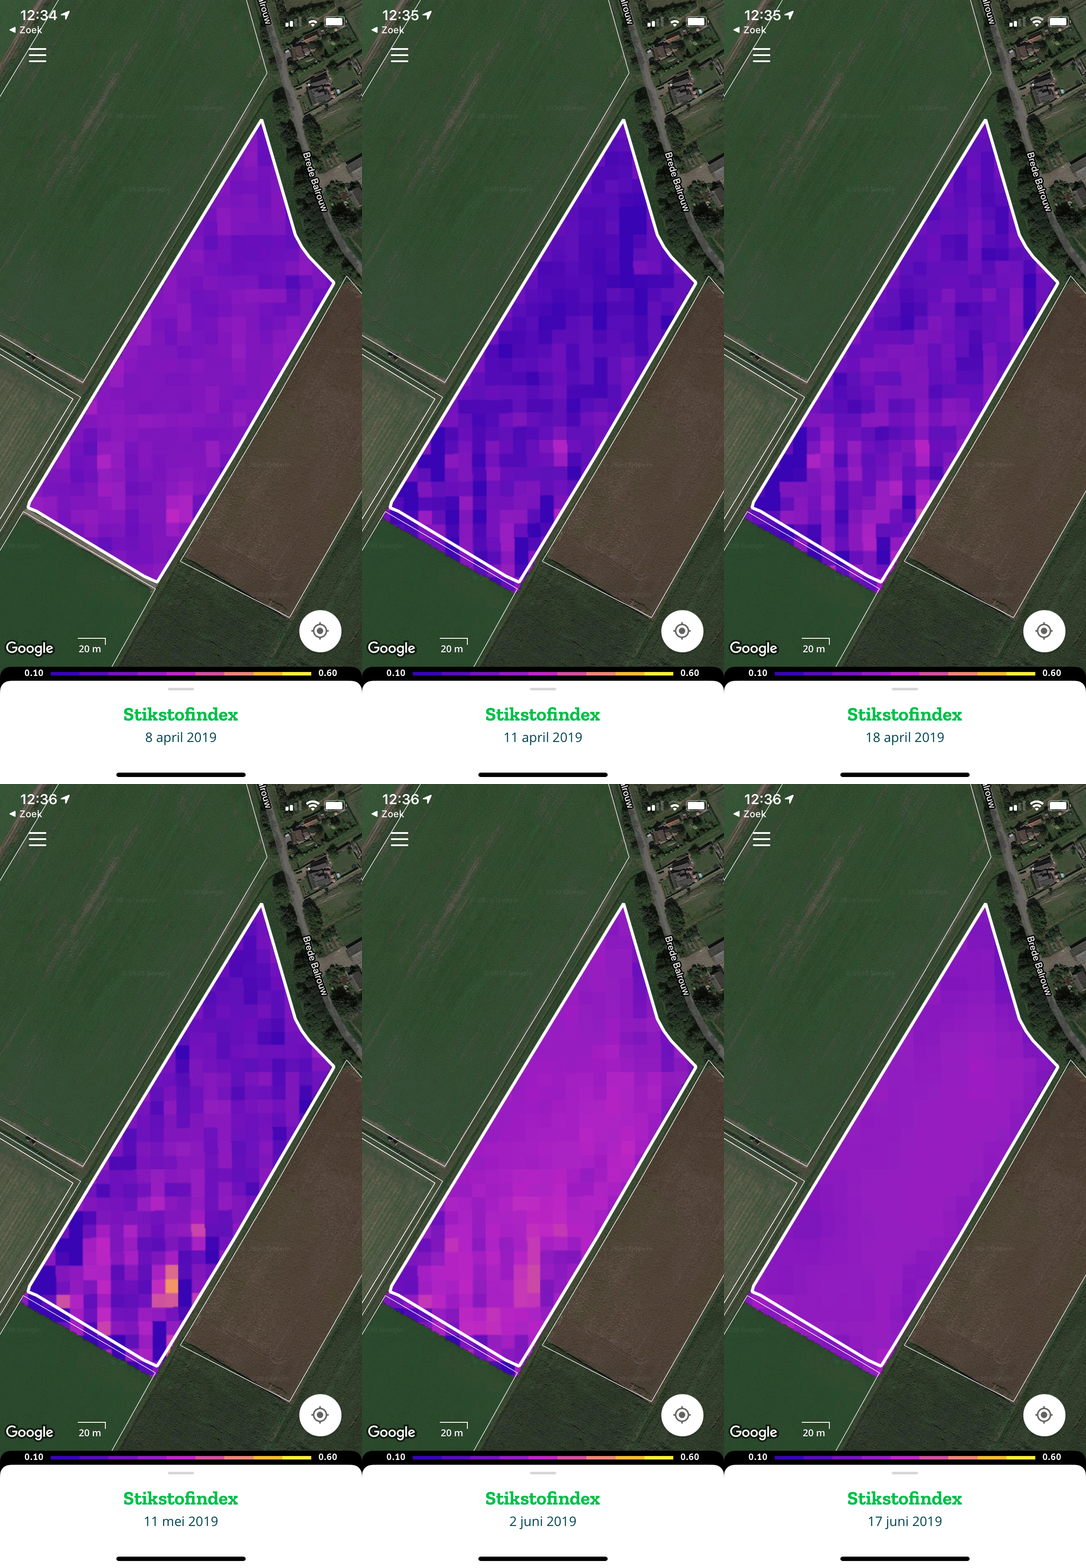
Nitrogen map
The Nitrogen map shows the nitrogen levels in the foliage expressed as a nitrogen index and their variation within in the field.
This index ranges from 0 to 1 and is specified in the legend. You can use a Nitrogen map to see how much available nitrogen there is in the greens of the plant (the higher the value the more nitrogen). Depending on the growth stage of the crop, you can estimate, on the basis of biomass and nitrogen, whether additional fertiliser is needed and in what place.
Note which value is shown in the legend. DBy default, the map shows a dynamic scale making the differences within the field optimally visible, however, the colour yellow (or purple) does not represent the same amount of nitrogen.
Map overview
Crop monitoring
Soil

