
![]()
Crop monitoring
With FieldScout, you can closely monitor your crops and soil. Get up-to-date biomass and nitrogen maps of your fields based on satellite images. In addition you get access to the Benchmark, a comparison tool and you can supplement your subscription with an irrigation signal (NL only). The basic subscription is free up to 10 hectares.
Tarieven FieldScout Gewasmonitoring
Onderstaande prijzen gelden vanaf 1 januari tot en met 31 december 2024. Alle prijzen zijn exclusief btw.
LTO-leden ontvangen op het Pro HD abonnement 1 euro korting per hectare.
U kunt uw gewenste abonnement bestellen in onze webwinkel. Maak eerst een account aan en selecteer uw percelen in de app.
Meest gekozen
Pro HD
Additional optimised images in HD quality
€ 371,90
bundel 25 hectare
Gemiddeld 50 beelden per seizoen
Vijf keer zoveel beelden als Pro.
U ontvangt extra veel beelden per seizoen door gebruik van meer satellieten.
High Definition image quality (3x3m/pixel)
When you choose the PRO HD subscription, you are opting for maximum quality. The high definition resolution is 3×3 metres versus the standard 10×10 metres. This allows the maps to be more accurately compared throughout the season.
Quality guarantee through our manual image examination
BioScope controleert de satellietbeelden voor uw percelen handmatig op wolken of andere verstoringen, waardoor de betrouwbaarheid in hoge mate vergroot wordt.
Calibrated maps
Op uw percelen kunt u gebruik maken van de volgende gewasmonitoringskaarten:
- Prestatiekaart
- Hoogtekaart
- Biomassakaart
- Bijgroeikaart
- Scoutingkaart
- Stikstofkaart
Benchmark
Met de Benchmark kunnen telers en adviseurs eenvoudig de gewasgroei op basis van biomassa en stikstof van percelen vergelijken.
Live position in your app (with boom on scale)
Add photos and notes on the spot (with geotag)
Vanaf 11,45 euro per hectare
Pro
Geoptimaliseeerde
kwaliteitsbeelden
€ 281,-
bundel 25 hectare
Gemiddeld 10 beelden per seizoen
Quality guarantee through our manual image examination
BioScope controleert de satellietbeelden voor uw percelen handmatig op wolken of andere verstoringen, waardoor de betrouwbaarheid in hoge mate vergroot wordt.
Calibrated maps
Op uw percelen kunt u gebruik maken van de volgende gewasmonitoringskaarten:
- Prestatiekaart
- Hoogtekaart
- Biomassakaart
- Bijgroeikaart
- Scoutingkaart
- Stikstofkaart
Benchmark
Met de Benchmark kunnen telers en adviseurs eenvoudig de gewasgroei op basis van biomassa en stikstof van percelen vergelijken.
Live position in your app (with boom on scale)
Add photos and notes on the spot (with geotag)
Vanaf 7,35 euro per hectare
Basic
Start nu snel en voordelig
€ 149,60
bundel 25 hectare
Gemiddeld 5 beelden per seizoen
Kaarten
Biomassa en hoogtekaarten
Benchmark
Met de Benchmark kunnen telers en adviseurs eenvoudig de gewasgroei op basis van biomassa en stikstof van percelen vergelijken.
Live position in your app (with boom on scale)
Add photos and notes on the spot (with geotag)
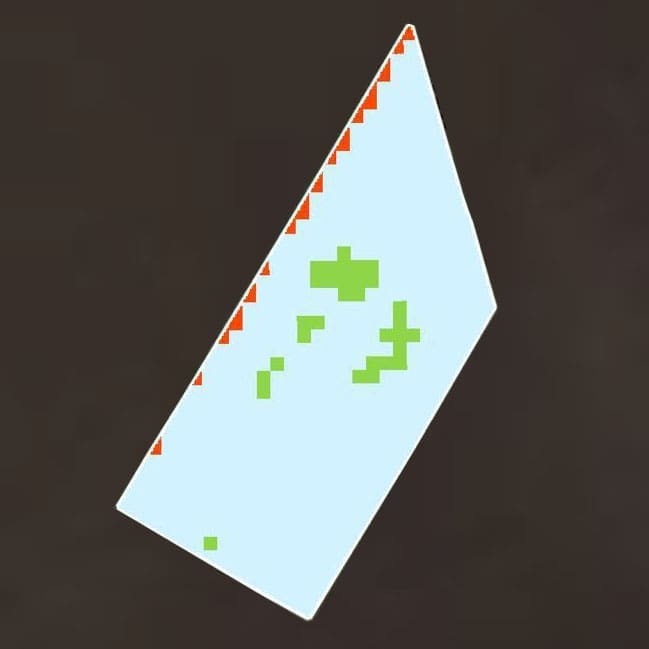
Crop monitoring maps
Performance Map
The Performance map overlooks the entire previous growing season. The map gives an insight into the yield potential of a field and its differences.
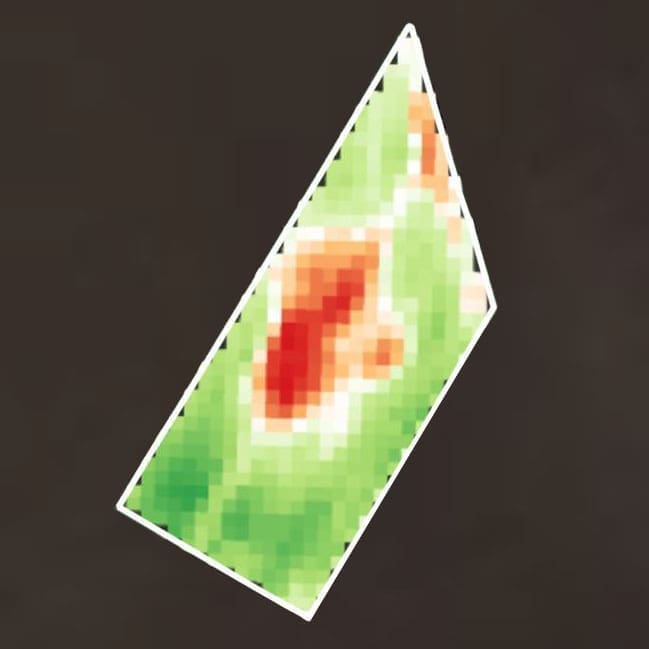
Biomass map
The Biomass map shows the current amount of biomass in a field and its variation. Is short this covers how much foliage of leaf mass the field has.
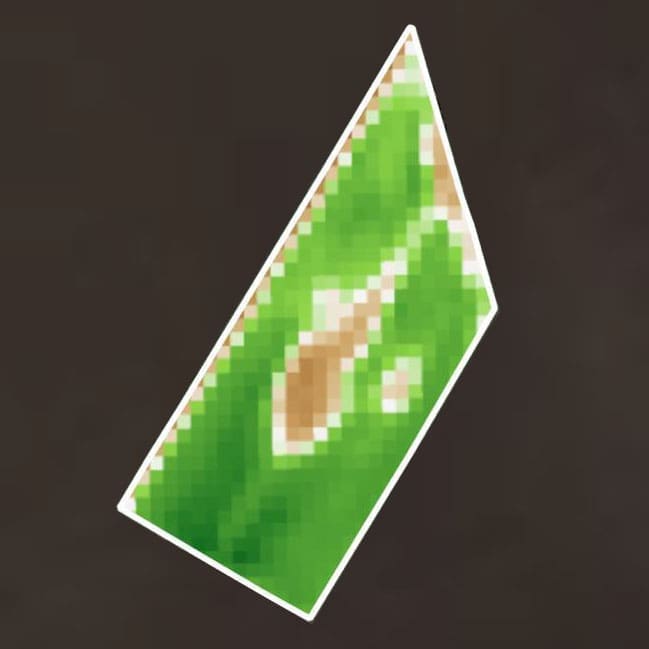
Vegetation Growth map
You can see the increase in biomass in the latest period on the by-growth map. the map shows where the crop grows at faster or slower pace.
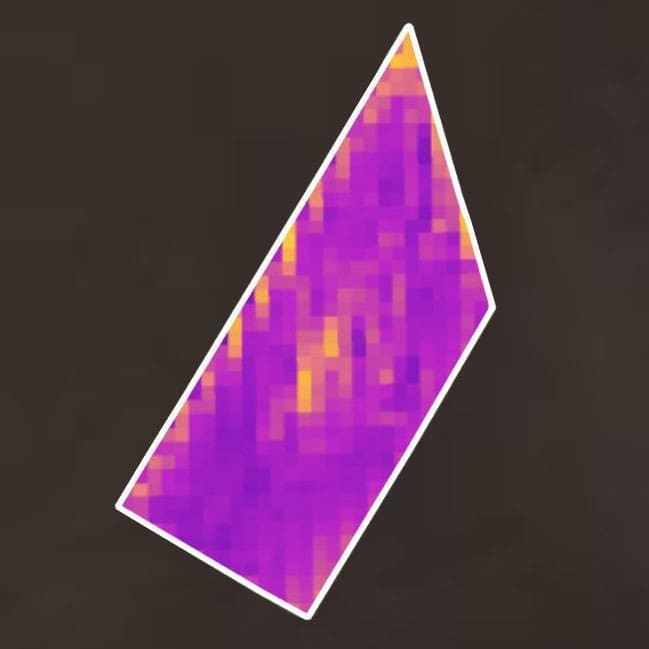
Nitrogen map
The Nitrogen map shows the nitrogen level in the foliage expressed as an index and its variation within the field.
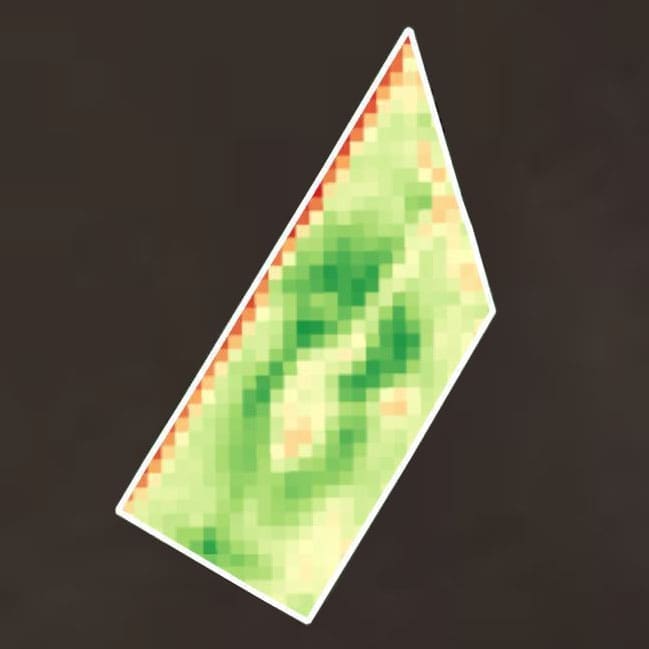
Scouting map
The Scouting map displays deviations from average growth within a field and highlights where the crop is excelling or underperforming.
Benchmark
The Benchmark compares the crop growth and nitrogen level of
a selected field with those of other plots in combination with a
grouped list based on crops types, varieties or cultivar names.
The selected period for the comparison is corrected for
planting or sowing dates and time of harvest.
Convenient for farmers and advisers, when identifying the cause of differences as a result of soil structures or crops between plots.
