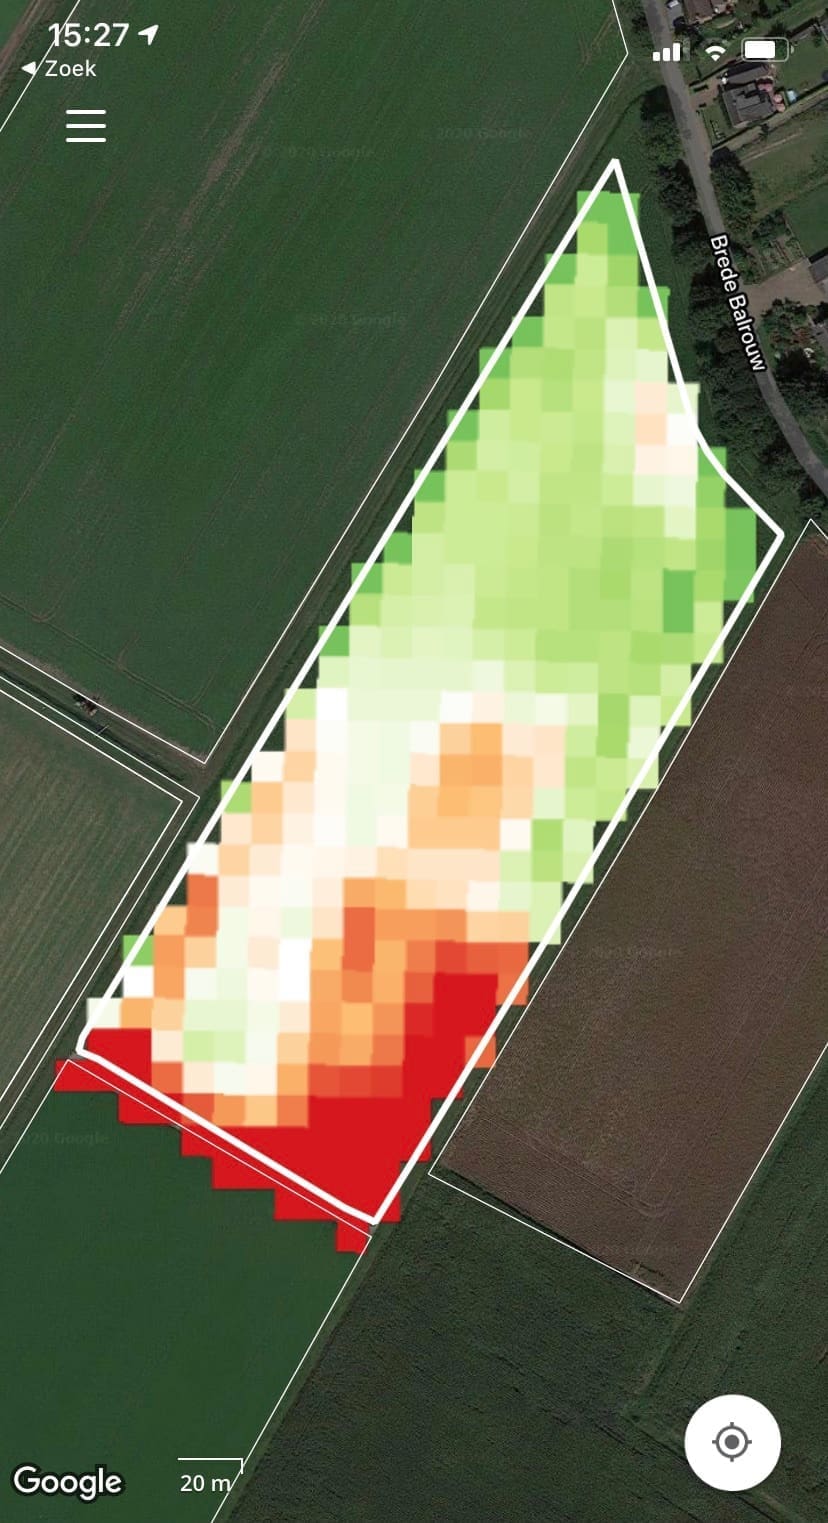
Performance map 2021
The Performance map overlooks the whole previous growing season.
For places with medium production, we set the performance of the crop to 100 per cent. The greater the range, the greater the variation in biomass. This way you can verify the situation in the plot in the places that did better and worse. In the scale, you find a percentage on both sides. These values are the minimum and maximum. Multiple Performance maps are available that match the growing season by year.
In 2022, at the end of the season, growers will have access to this year’s Performance map. This also makes it a helpful tool for next season’s crop planning. After that, more years will be added. If growers start working with multiyear performance figures, structural effects can be distinguished from one-time effects. This will make the consistent differences more and more clear.
Map overview
Crop monitoring
Soil
What do you use the Performance map for?
The Performance map gives you insight into the yield potential of a field and its variations. Choose the best crop and variety for your farm, decide on the layout of your fields or the effectiveness of your inputs. This is also very convenient for valuation when buying or renting a plot. For this reason, the Performance Map is freely available for every plot in the Netherlands.
Want to know more?
Watch the video or read this article.

