BioScope’s maps
The assurance of an additional pair of eyes.
Gain better insight into crop growth. Make substantiated decisions. Improve your farming.
The BioScope information maps are based on up-to-date satellite images. These satellite images are screened for cloud coverage and quality, with excellent calibration. This makes our images comparable in the time sequence. Our maps are issued frequently and are available within 24 hours of recording.
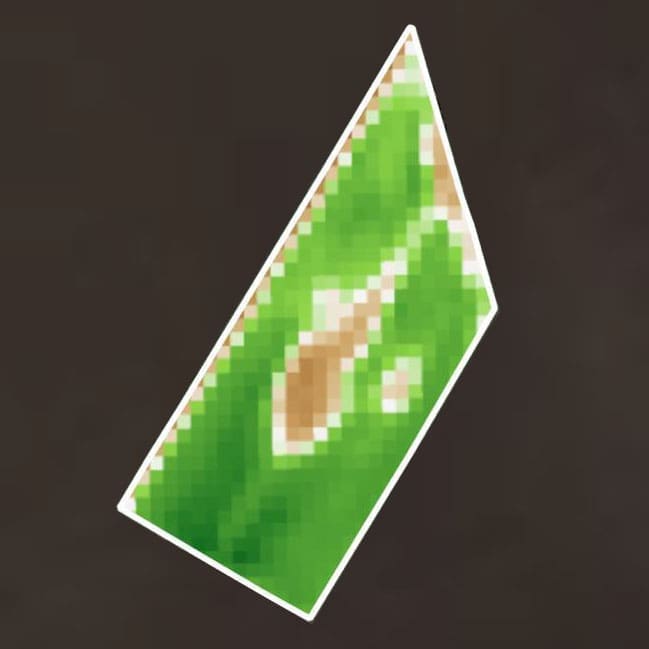
Performance Chart 2021
The Performance Map gives you insight into the yield potential of a field and the differences between them.
Choose the best crop and variety for your farm, decide on the layout of your fields or the effectiveness of your inputs. The performance map is also very convenient for valuation in the event of purchase or rental, that is why we made it available for every plot in the Netherlands.
The Performance Map looks at the complete previous growing season. Where the production is average, we set the performance of the crop to 100. Some sections are below average and some above. The greater the distribution, the greater the variation in yield. Subsequently you can inspect the plot to see what the condition is in the places that did better and worse.
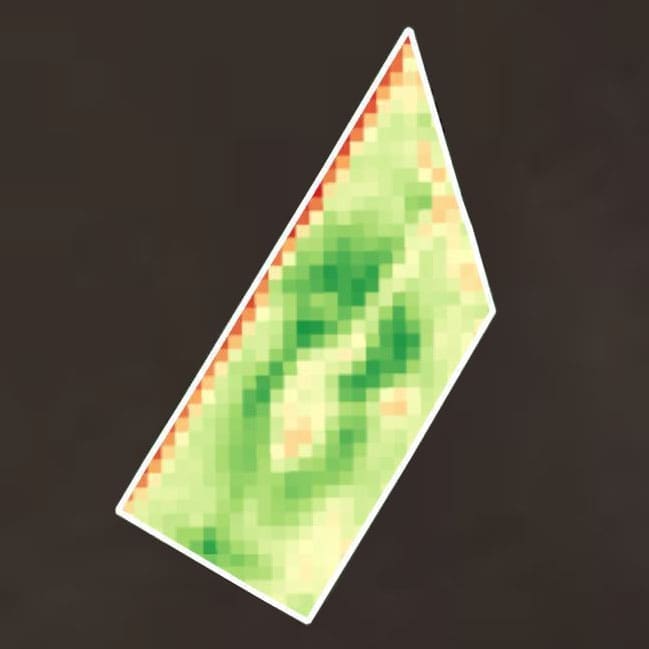
Biomass map
The Biomass Map measures the amount of biomass in a field and its variation.
You can easily observe how much foliage there is in the base. The pattern of biomass is the result of various growth factors. You can put this map alongside the Soil Zone map and Nitrogen map and purposefully enter the field to see if there is any problem.
Regrowth map
You can see how much biomass/leaf has grown on the tree growth chart.
Not only the quantity of biomass is important, but in particular the speed of (lagging) growth. For example, you can easily see where new leaves have formed and whether (additional) crop protection is needed. Looking at the crop in the field is quicker and above all more effective if you know precisely where to look. The Scouting map and Regrowth map are perfect tools for this.
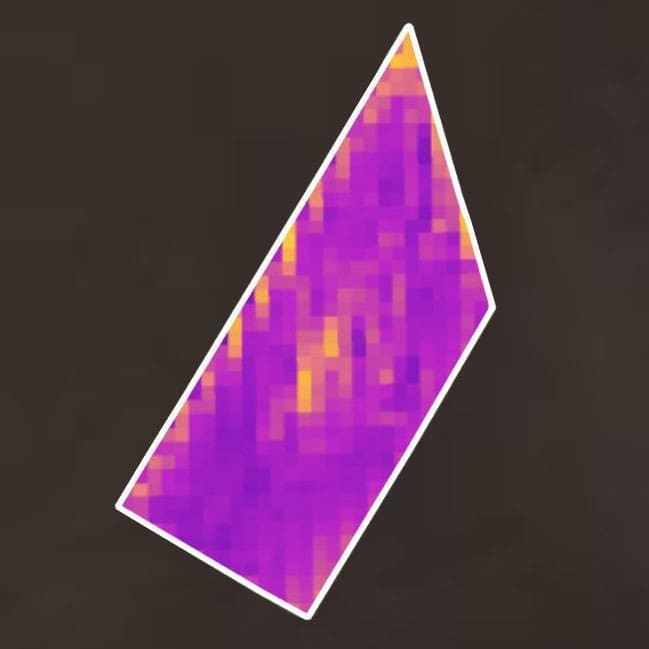
Nitrogen map
This map shows the amount of nitrogen in the leaf and its variation in a field.
You can use a Nitrogen map to see how much nitrogen is present in the green plant parts, which is available for growth. Depending on the growth stage of the crop, you can estimate, on the basis of biomass and nitrogen, whether additional fertiliser is needed and in what place.
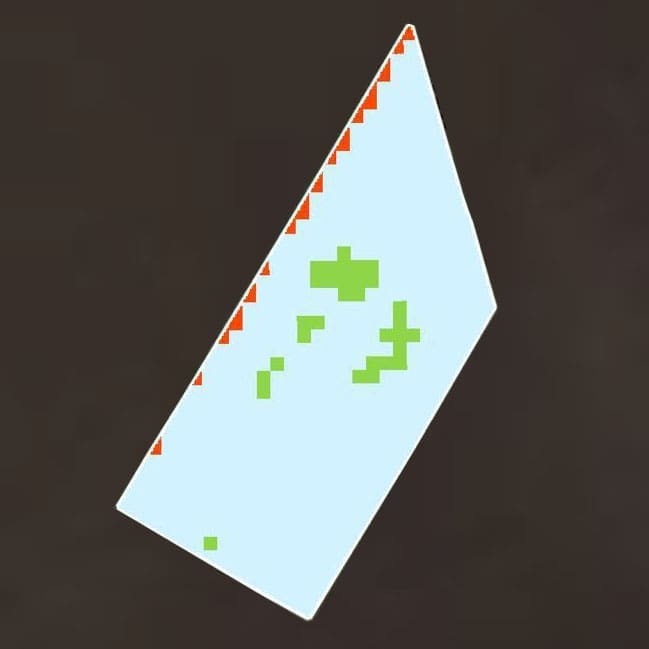
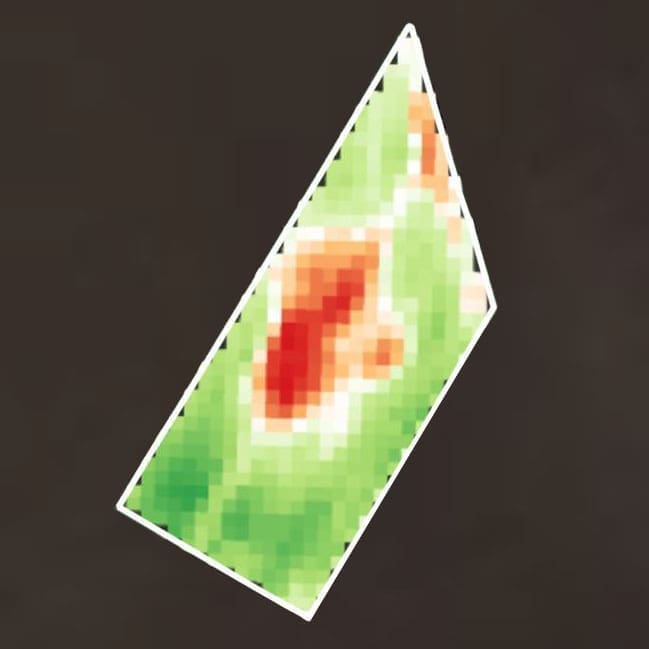
Scouting map
Scouting maps show the deviations from average growth within a field.
Scouting maps are information maps that specifically indicate where the crop is growing faster or lagging behind the rest of the field. You can quickly see the differences in the crop, so you can work on goal-oriented solutions. The Scouting map is an excellent tool on your plot inspections. It focuses your view. The red pixels indicate slower growth and the green pixels a faster growth than the average of the plot.
Combine the Scouting map with other maps to a better understanding of the causes. This map also shows the size of an underdeveloped spot, enabling you to make a better estimate of the size of a possible problem.
With the note functionality, you can specify your findings on a location-specific basis so that you can retrieve it later on.
The added value of BioScope
With the BioScope maps, you can gain more insight into the crop by identifying soil zones and scouting for stunted or rapid growth. This way, you can easily make well informed decisions to optimise your production.
Technology is primarily a human endeavour. Our advisers have a great deal of knowledge and experience and will be happy to help you!
Calibrated and indexed
Checked for atmospheric disturbance
Support and advice on use
Combine the advantages of satellite and drone.
Only BioScope gives you the optimal combination of geodata via satellite and drone. An additional module allows you to supplement the satellite images with drone images, so that you are assured of up-to-date crop and soil maps at all times. No difference can be seen in your application.
Satellite
Over the past few years, the number of satellites with usable sensors has increased significantly, making more and more images available. BioScope has signed supply agreements with a number of relevant satellite companies.
 Drones
 Drones
When clouds prevent aerial shots for too long, drones can be used. This combination provides security at an affordable price. In addition to the basic package, drone images are used on request at a surcharge in line with the market.