
Determining if,
where and how much
you can harvest
With the harvest forecast from VanBoven
✔ See how much of which size you can harvest.
✔ Determine the best place to start harvesting.
✔ Cut more consistent sizes.
✔ Increase harvest speed: even parts first.
✔ Determine whether a round of harvesting is already useful.
More control
over your harvest
Drones measure the diameter of broccoli screens and provide an overview of the spread in a plot or plant batch. This data helps make better decisions during harvest, such as when to harvest a plot, whether to harvest all or part of it and when to schedule a follow-up harvest visit.

VanBoven provides the data needed to get a better handle on growth and harvest
✔ More than 1000+ measurements per plot.
✔ Satellite data from planting to harvesting.
✔ Virtual weather posts for site-specific weather.
✔ Growth model based on weather and location.
Determine the ideal moment
Satellite data is used to track growth progress: is the broccoli growing faster or later than expected, is a plot growing up evenly or is there a lot of spread in the crop. Satellite data is used to track growth progress: is the broccoli growing faster or later than expected, is a plot growing up evenly or is there a lot of spread in the crop. And VanBoven knows when is the best time to fly drones.

Broccoli growth curve

Mid-season spread biomass.
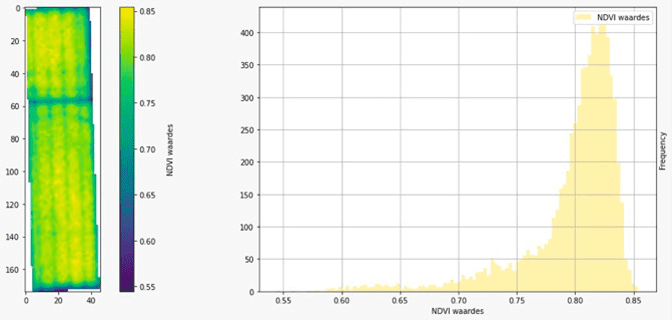
Crop just before harvest: biomass equal but initial spread translates into lagging screen formation.

Data for the
the whole chain
Temperature and moisture are important growth factors that determine how and when the crop reaches the harvest stage for many crops. VanBoven’s virtual weather posts help you map temperature and moisture for each plot or plant batch. This allows you to see in time if the supply deviates from expectations. This is how VanBoven helps you with data throughout the chain.